
animated attack map ...
... using Splunk

I totally agree in those who say, that displaying information this way will not get you any respect from the real cyber guys.
But please take my appologies, as I sometime have to do non-techy-stuff for the management and the decission makers that are not fully up to date the technology.
For those kind a audiance, the "missile app" will do an outstanding job by visualizing threats for those that do not get the complete technical background.
I remembered the impact that the Fireeye Threat Map made to my management and I was always looking for something like that to be implemented within my Splunk that already hosts all the data. Now, with this app, youre able to create your own attack-map just as easy as creating a geoip-base map from your IP's.
All you need to add is ... | iplocation src_ip prefix=start_ | iplocation dest_ip prefix=end_ using the right fieldnames for your src- and destination IP.
Now choose below visualization from Splunk and adjust colors and stuff from the format tab.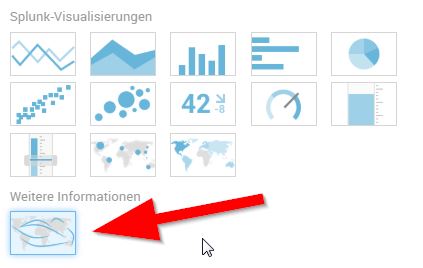
The outcome will be:
Use below search to default your source to Munoich/Germany and the destination to the NSA in Maryland in case the IP cannot by localized.
index=* sourcetype="sophos:utm:*" AND (src_ip=* AND dest_ip=*) | iplocation src_ip prefix=start_ | iplocation dest_ip prefix=end_ | fillnull start_lat value=48.137154 | fillnull start_lon value=11.576124 | fillnull end_lat value=39.112066 | fillnull end_lon value=-76.770766 | head 100 | table start_lat start_lon end_lat end_lon | eval animate="yes", pulse_at_start="yes"