Grafana für die Visualisierung nutzen
- sudo apt-get install -y apt-transport-https
- sudo apt-get install -y software-properties-common wget
- wget -q -O - https://packages.grafana.com/gpg.key | sudo apt-key add -
- echo "deb https://packages.grafana.com/enterprise/deb stable main" | sudo tee -a /etc/apt/sources.list.d/grafana.list
- sudo apt-get update
- sudo apt-get install grafana-enterprise
- sudo /bin/systemctl daemon-reload
- sudo /bin/systemctl enable grafana-server
- sudo /bin/systemctl start grafana-server
- ifconfig
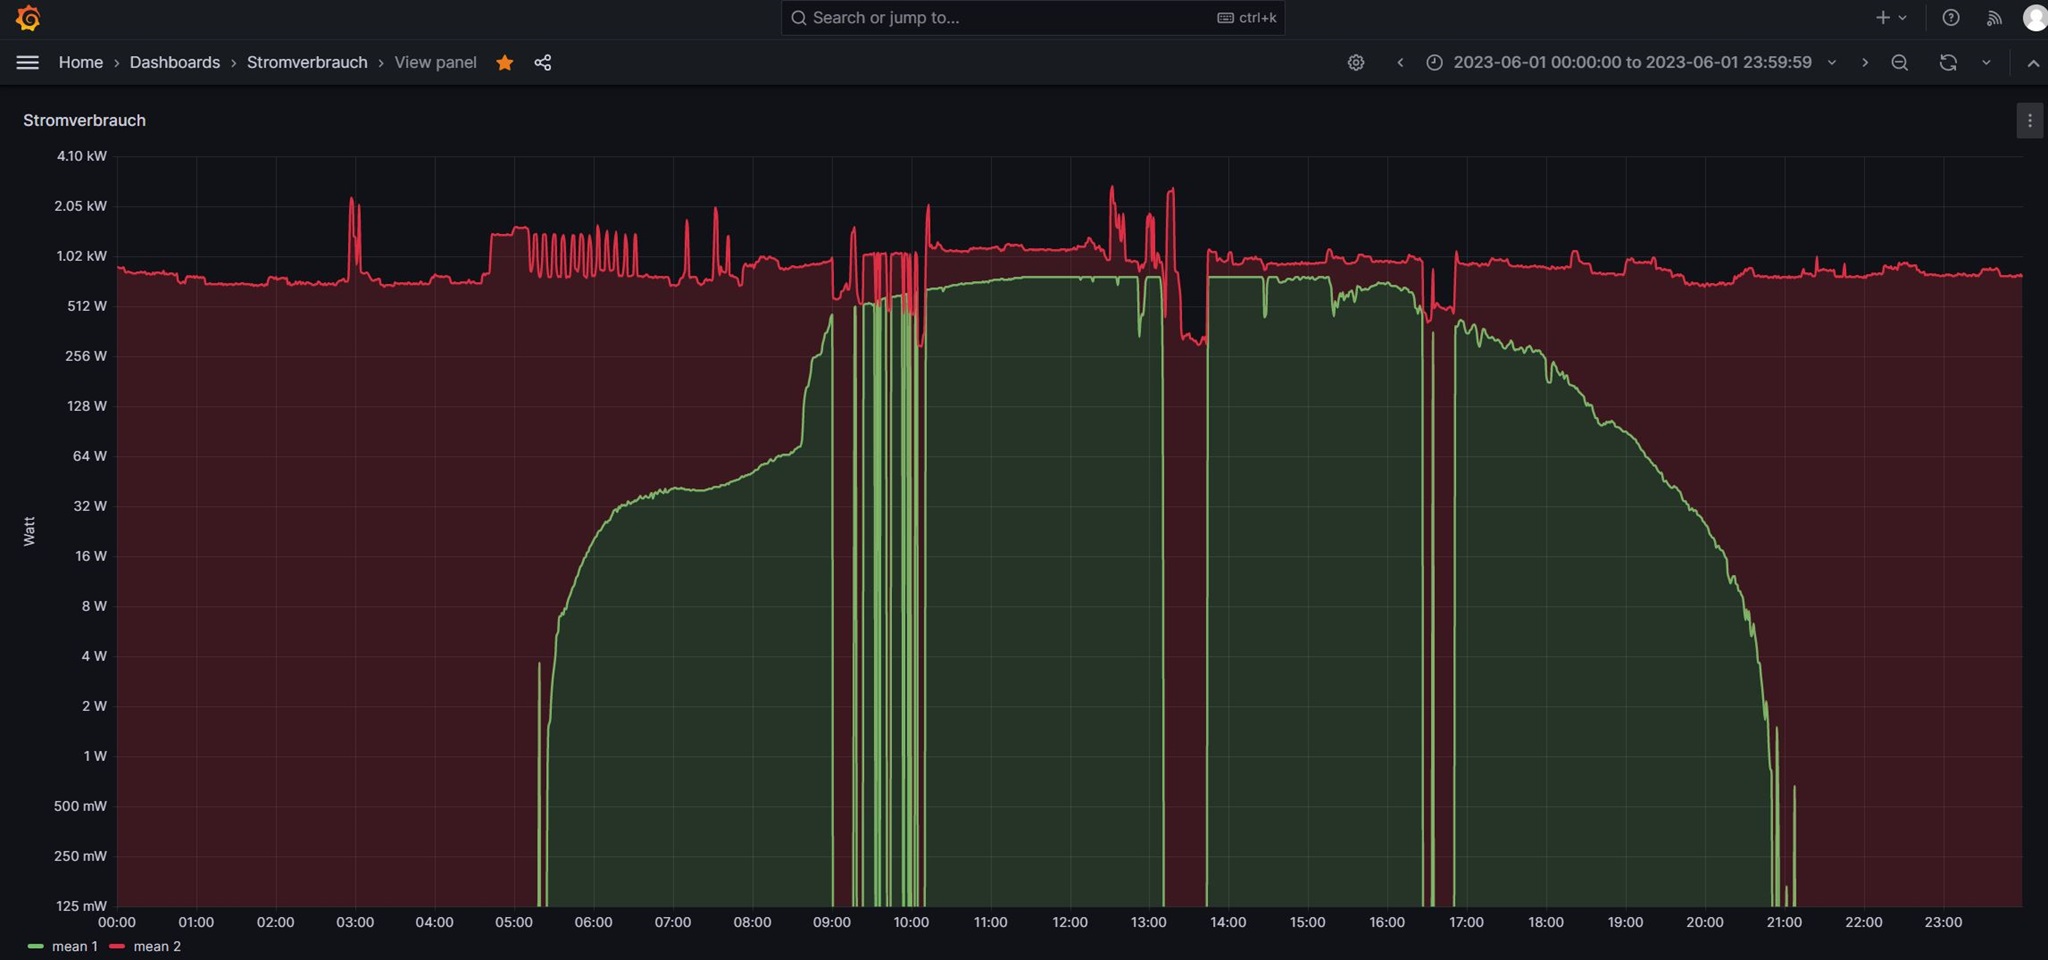
Main power consuption showing the amount of self generated power
Showing a total of power consumption (thick red line) and the part of power that is self generated (green area) versus the amount that has to be bought from my energy provider (red area). (json)
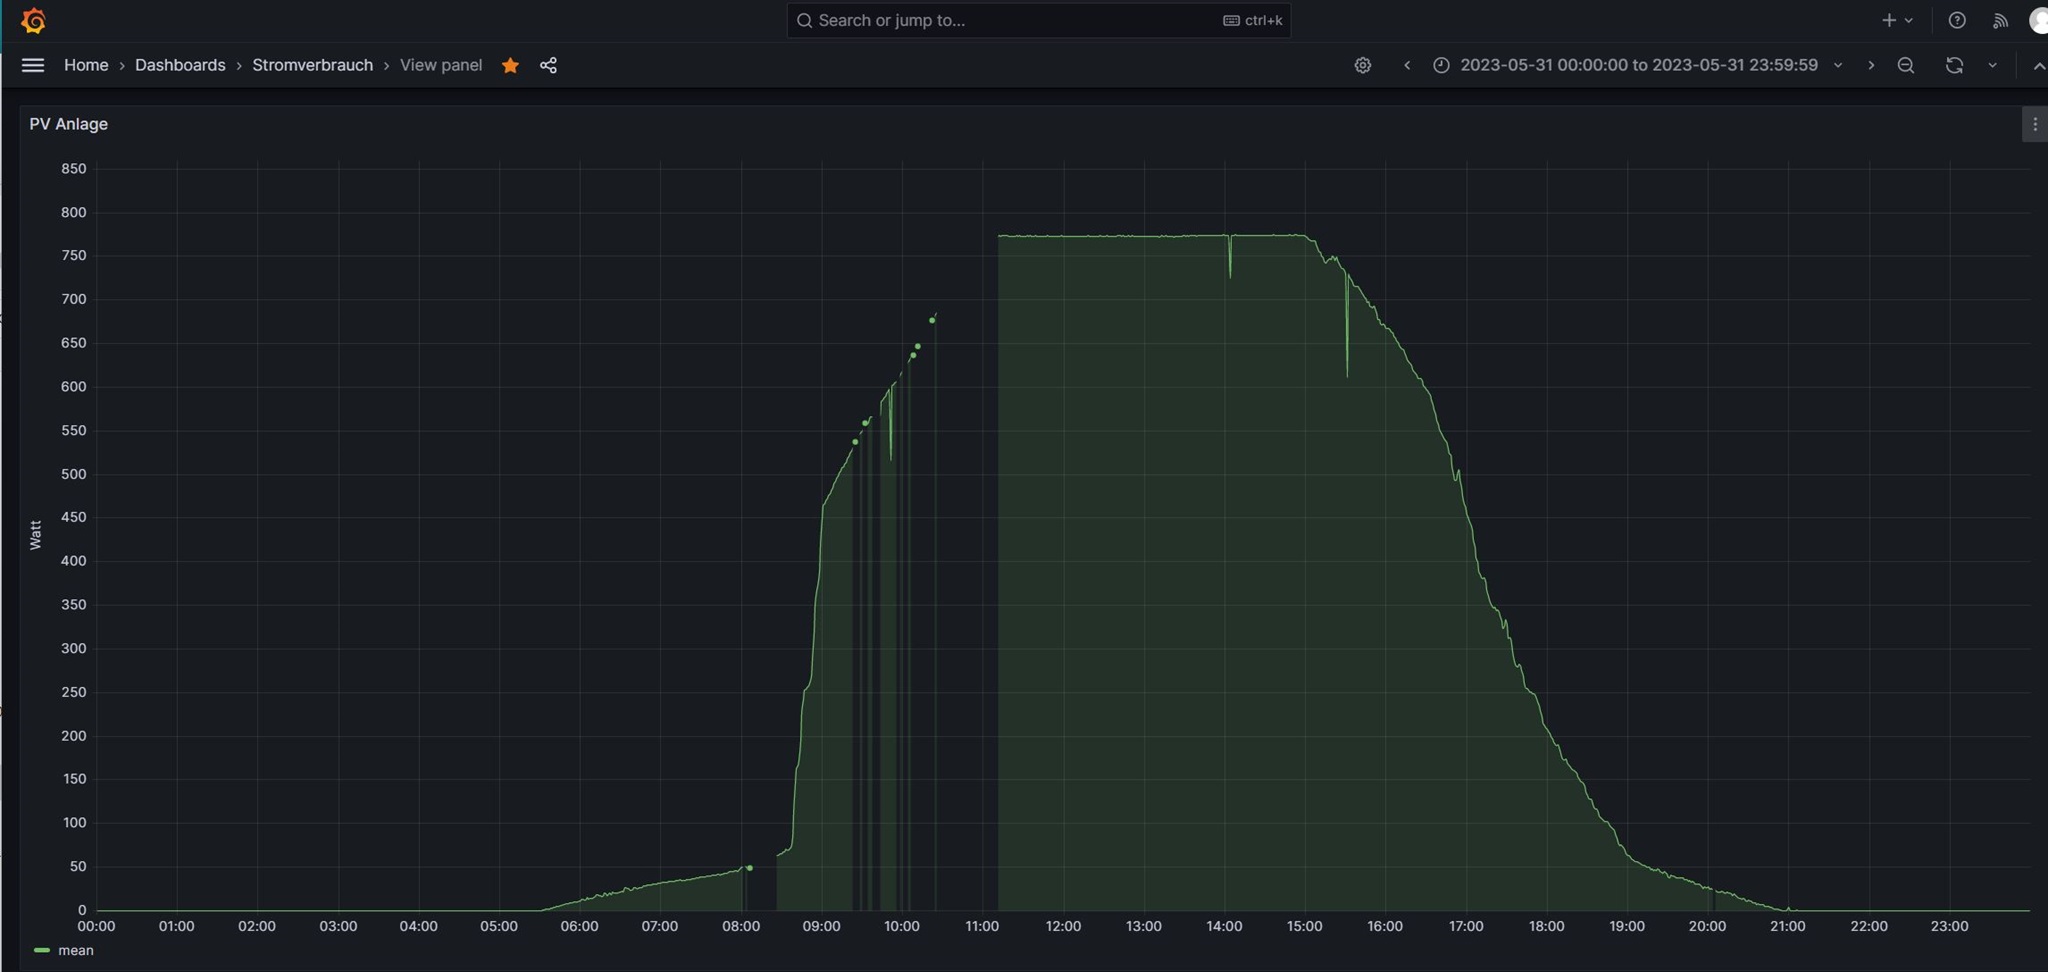
PS generated power
Just the socket that monitors the photovoltaic systems input via the socket. (json)
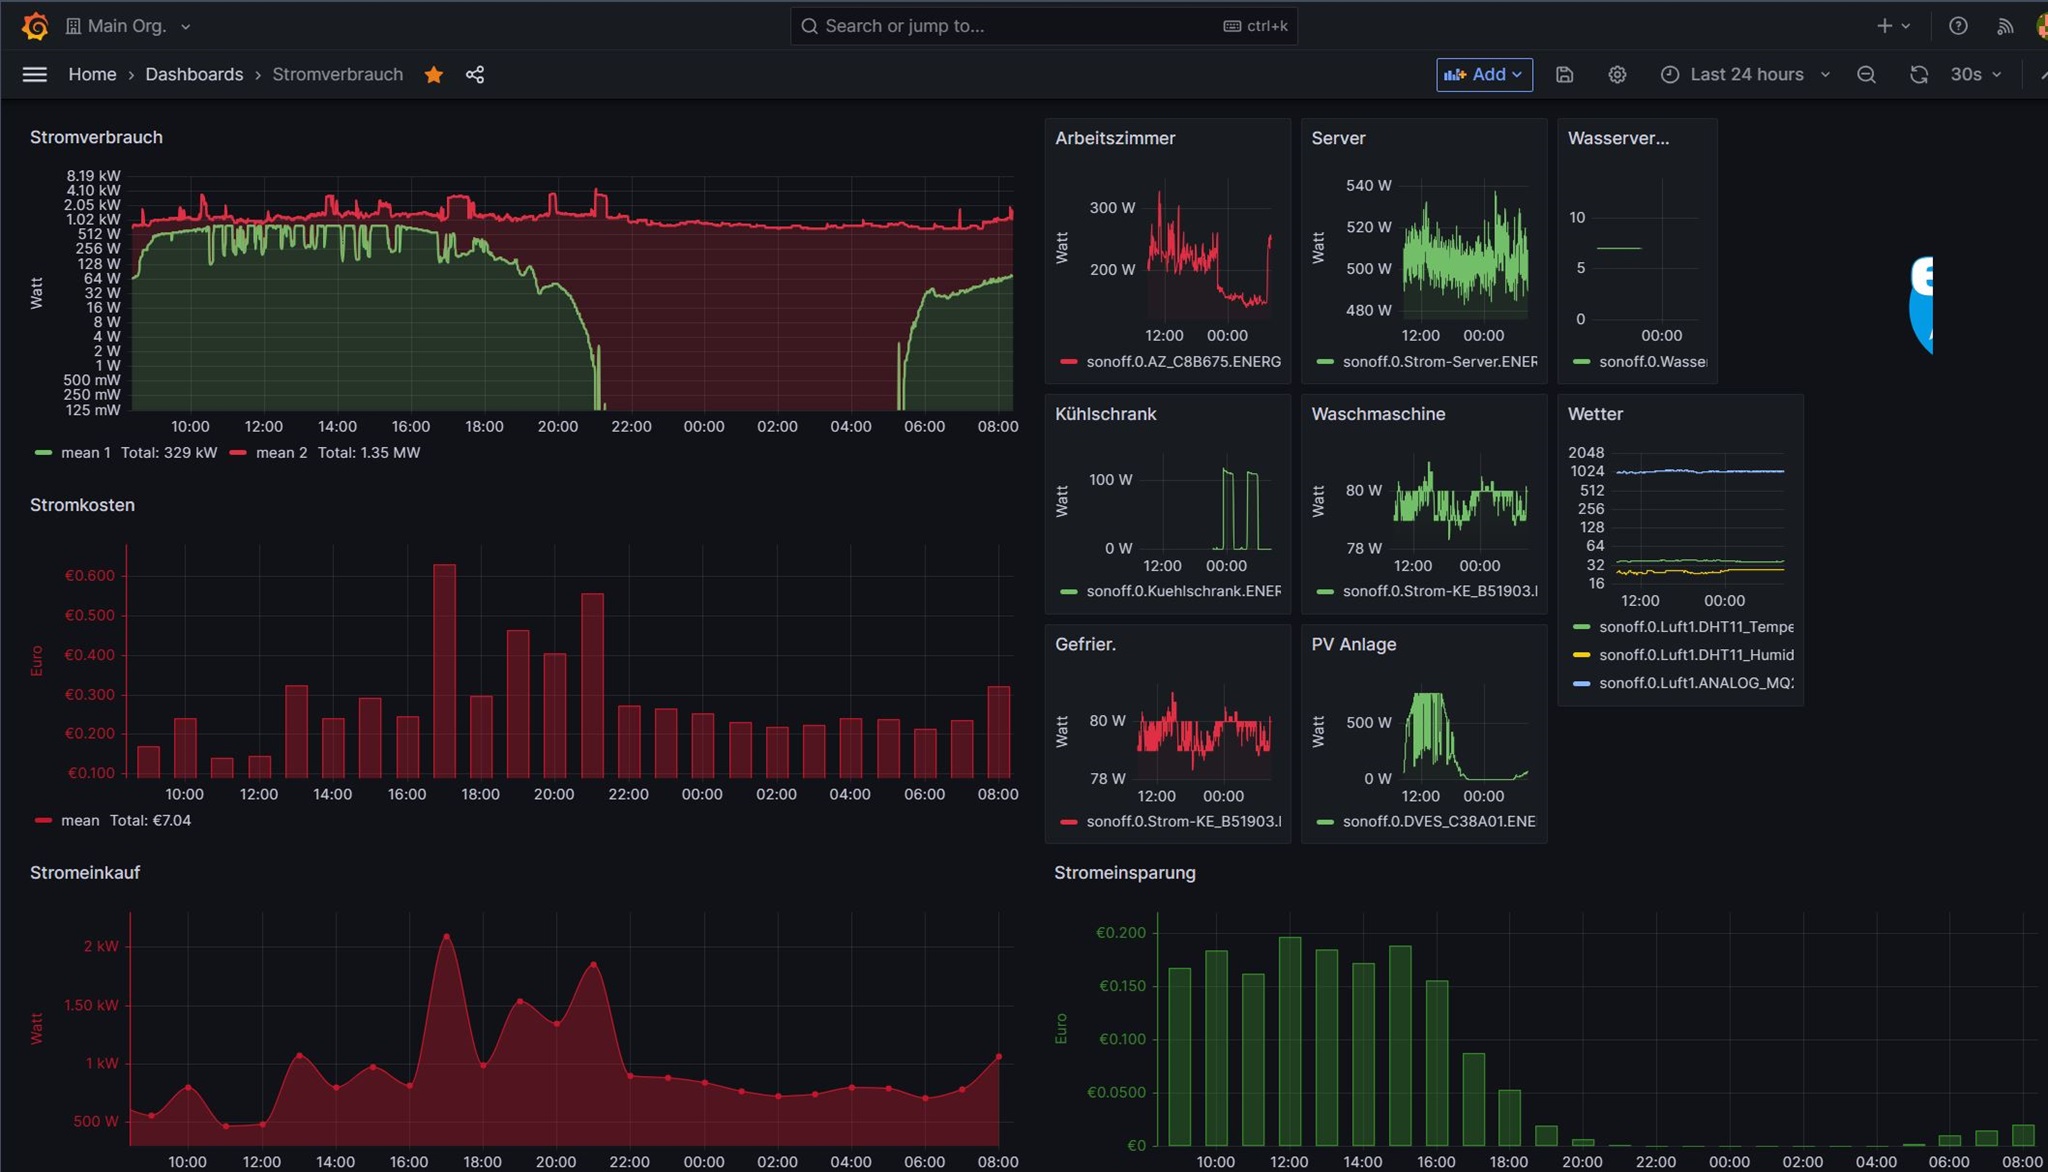
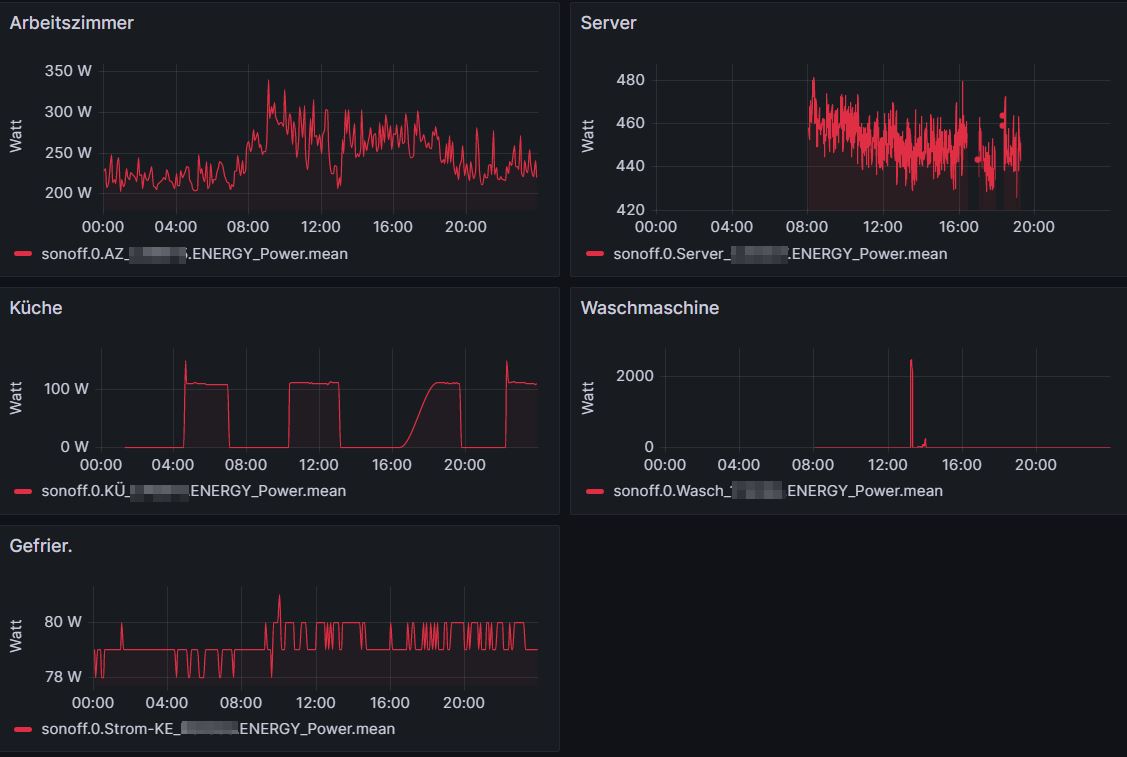
Detailed power consumption
Each Tasmota socket being a dedicated monitoring of some special equipment. (json)
All together: The main dashboard
"Power consumption" in grafana (json)